Aggregate_Function
Aggregate_Function
Aggregate_Function
집계
1
2
3
4
5
6
7
8
9
10
11
import numpy as np

# 배열을 특정 연산으로 축소 --> reduce
# 결과가 하나만 남을 때까지 해당 연산을 배열 요소에 반복 적용
x = np.arange(1, 6)
print("np.add.reduce(x): ", np.add.reduce(x))
print("np.multiply.reduce(x): ", np.multiply.reduce(x))

# 계산의 중간 결과를 모두 저장할 때 --> accumulate
print("\nnp.add.accumulate(x): ", np.add.accumulate(x))
print("np.multiply.accumulate(x): ", np.multiply.accumulate(x))
1
2
3
4
5
np.add.reduce(x):  15
np.multiply.reduce(x):  120

np.add.accumulate(x):  [ 1  3  6 10 15]
np.multiply.accumulate(x):  [  1   2   6  24 120]
1
2
3
4
5
6
7
8
# 다차원 집계
M = np.random.random((3, 4))
print("M:\n", M)
print("\nM.sum():", M.sum())
# axis = 0 --> 열
print("M.min(axis=0):", M.min(axis=0))
# axis = 1 --> 행
print("M.max(axis=1):", M.max(axis=1))
1
2
3
4
5
6
7
8
M:
 [[0.84532909 0.99285955 0.52913737 0.65008447]
 [0.77129559 0.26725532 0.22653881 0.34216082]
 [0.13813774 0.48090258 0.65561097 0.09940827]]

M.sum(): 5.998720605142955
M.min(axis=0): [0.13813774 0.26725532 0.22653881 0.09940827]
M.max(axis=1): [0.99285955 0.77129559 0.65561097]
Example
1
2
3
4
5
6
7
8
9
10
11
12
13
import pandas as pd

data = pd.read_csv('./president_heights.csv')
heights = np.array(data['height(cm)'])
print("heights:\n", heights)
print("Mean height: ", heights.mean())  # 요소 평균 계산
print("Standard deviation: ", heights.std())  # 표준 편차 계산
print("Minimum height: ", heights.min())
print("Maximum height: ", heights.max())
print("25th percentile: ", np.percentile(heights, 25))  # 요소의 순위 기반 백분위 수 계산
print("Median: ", np.median(heights))  # 요소의 중앙값 계산
print("75th percentile: ", np.percentile(heights, 75))
print("variance: ", heights.var())  # 분산 계산
1
2
3
4
5
6
7
8
9
10
11
12
heights:
 [189 170 189 163 183 171 185 168 173 183 173 173 175 178 183 193 178 173
 174 183 183 168 170 178 182 180 183 178 182 188 175 179 183 193 182 183
 177 185 188 188 182 185 191 182]
Mean height:  180.04545454545453
Standard deviation:  6.983599441335736
Minimum height:  163
Maximum height:  193
25th percentile:  174.75
Median:  182.0
75th percentile:  183.5
variance:  48.7706611570248
1
2
3
4
5
6
7
8
9
10
%matplotlib
inline
import matplotlib.pyplot as plt
import seaborn;
seaborn.set()
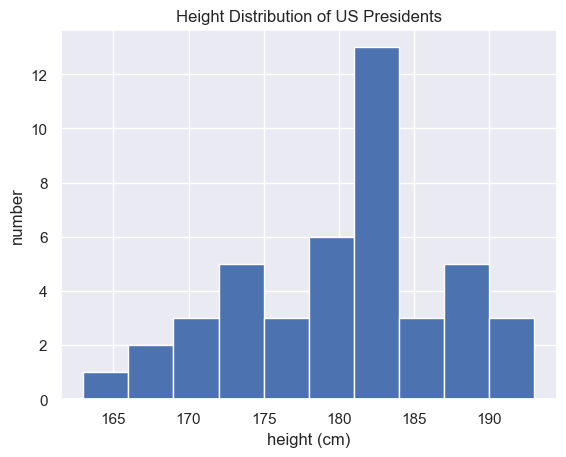
plt.hist(heights)
plt.title('Height Distribution of US Presidents')
plt.xlabel('height (cm)')
plt.ylabel('number');
이 기사는 저작권자의 CC BY-NC 4.0 라이센스를 따릅니다.