Three_Dimensional_Plotting
Three_Dimensional_Plotting
Three-Dimensional Plotting in Matplotlib
1
2
3
4
5
6
7
8
9
from mpl_toolkits import mplot3d

%matplotlib
inline
import numpy as np
import matplotlib.pyplot as plt

fig = plt.figure()
ax = plt.axes(projection='3d')
Three-dimensional Points and Lines
1
2
3
4
5
6
7
8
9
10
11
12
13
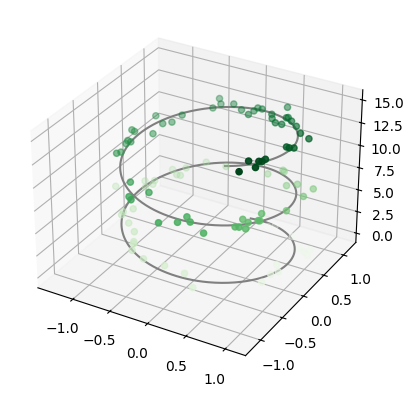
ax = plt.axes(projection='3d')
# Data for a three-dimensional line
zline = np.linspace(0, 15, 1000)
xline = np.sin(zline)
yline = np.cos(zline)
ax.plot3D(xline, yline, zline, 'gray')
# Data for three-dimensional scattered points
zdata = 15 * np.random.random(100)
xdata = np.sin(zdata) + 0.1 * np.random.randn(100)
ydata = np.cos(zdata) + 0.1 * np.random.randn(100)
ax.scatter3D(xdata, ydata, zdata, c=zdata, cmap='Greens');
Three-dimensional Contour Plots
1
2
3
4
5
6
7
8
9
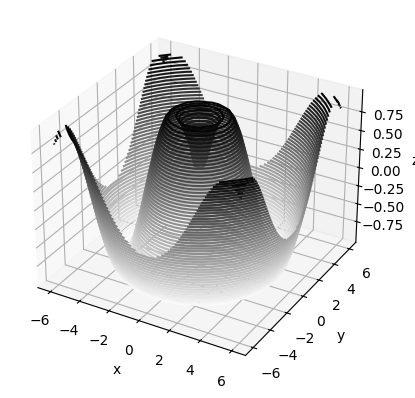
def f(x, y):
return np.sin(np.sqrt(x ** 2 + y ** 2))
x = np.linspace(-6, 6, 30)
y = np.linspace(-6, 6, 30)
X, Y = np.meshgrid(x, y)
Z = f(X, Y)
1
2
3
4
5
6
fig = plt.figure()
ax = plt.axes(projection='3d')
ax.contour3D(X, Y, Z, 50, cmap='binary')
ax.set_xlabel('x')
ax.set_ylabel('y')
ax.set_zlabel('z');
1
2
3
# 고도와 방위각 설정
ax.view_init(60, 35)
fig

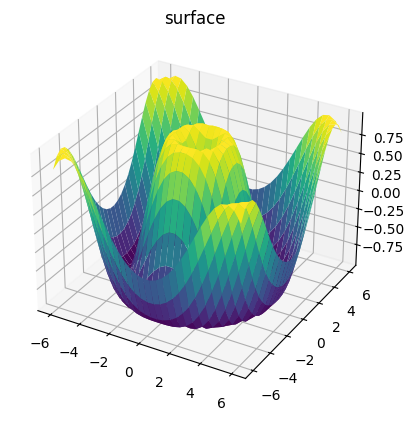
Wireframes and Surface Plots
1
2
3
4
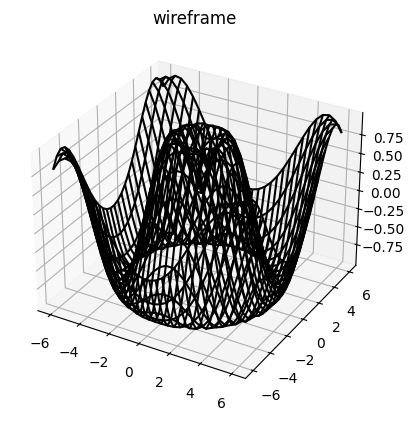
fig = plt.figure()
ax = plt.axes(projection='3d')
ax.plot_wireframe(X, Y, Z, color='black')
ax.set_title('wireframe');
1
2
3
4
ax = plt.axes(projection='3d')
ax.plot_surface(X, Y, Z, rstride=1, cstride=1,
                cmap='viridis', edgecolor='none')
ax.set_title('surface');
1
2
3
4
5
6
7
8
9
10
11
12
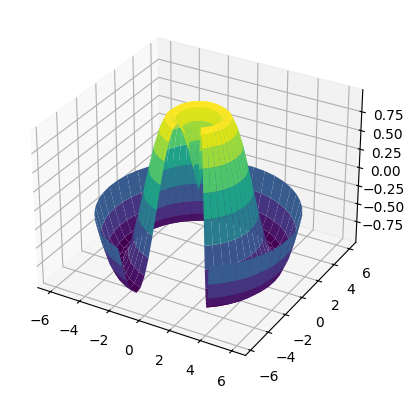
# 극좌표 표면도
r = np.linspace(0, 6, 20)
theta = np.linspace(-0.9 * np.pi, 0.8 * np.pi, 40)
r, theta = np.meshgrid(r, theta)
X = r * np.sin(theta)
Y = r * np.cos(theta)
Z = f(X, Y)
ax = plt.axes(projection='3d')
ax.plot_surface(X, Y, Z, rstride=1, cstride=1,
cmap='viridis', edgecolor='none');
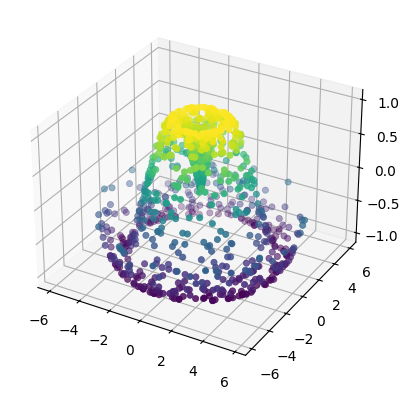
Surface Triangulations
1
2
3
4
5
theta = 2 * np.pi * np.random.random(1000)
r = 6 * np.random.random(1000)
x = np.ravel(r * np.sin(theta))
y = np.ravel(r * np.cos(theta))
z = f(x, y)
1
2
3
# 3차원 샘플링 표면
ax = plt.axes(projection='3d')
ax.scatter(x, y, z, c=z, cmap='viridis', linewidth=0.5);
1
2
3
4
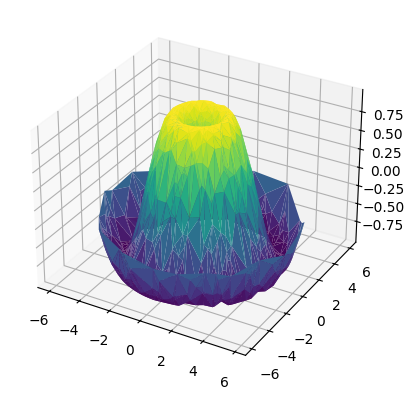
# 삼각측량 표면도
ax = plt.axes(projection='3d')
ax.plot_trisurf(x, y, z,
cmap='viridis', edgecolor='none');
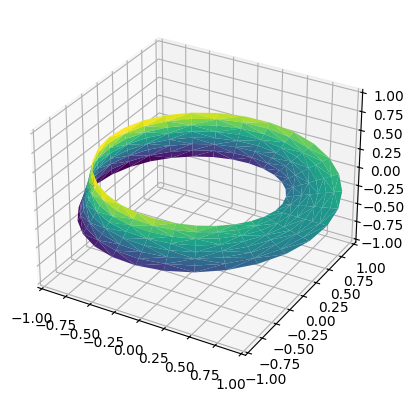
Example: Visualizing a Möbius strip
1
2
3
theta = np.linspace(0, 2 * np.pi, 30)
w = np.linspace(-0.25, 0.25, 8)
w, theta = np.meshgrid(w, theta)
1
phi = 0.5 * theta
1
2
3
4
5
6
# radius in x-y plane
r = 1 + w * np.cos(phi)

x = np.ravel(r * np.cos(theta))
y = np.ravel(r * np.sin(theta))
z = np.ravel(w * np.sin(phi))
1
2
3
4
5
6
7
8
9
10
11
12
13
# 기본 모수화에서 삼각 측량법 정의
# triangulate in the underlying parametrization
from matplotlib.tri import Triangulation

tri = Triangulation(np.ravel(w), np.ravel(theta))

ax = plt.axes(projection='3d')
ax.plot_trisurf(x, y, z, triangles=tri.triangles,
                cmap='viridis', linewidths=0.2);

ax.set_xlim(-1, 1);
ax.set_ylim(-1, 1);
ax.set_zlim(-1, 1);
이 기사는 저작권자의 CC BY-NC 4.0 라이센스를 따릅니다.