Settings_And_Stylesheets
Settings_And_Stylesheets
Customizing Matplotlib: Configurations and Stylesheets
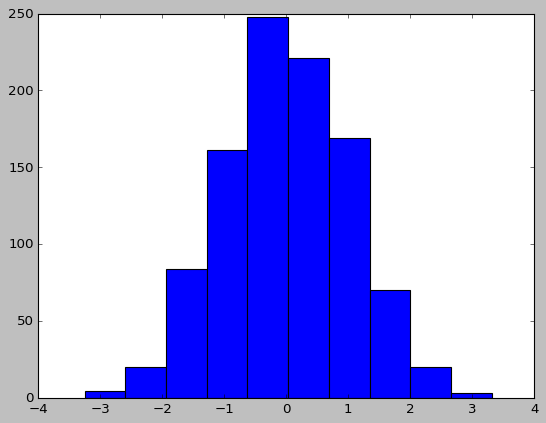
Plot Customization by Hand
1
2
3
4
5
6
7
8
9
10
import matplotlib.pyplot as plt

plt.style.use('classic')
import numpy as np

%matplotlib
inline

x = np.random.randn(1000)
plt.hist(x);
1
2
3
4
5
6
7
8
9
10
11
12
13
14
15
16
17
18
19
20
21
22
23
24
25
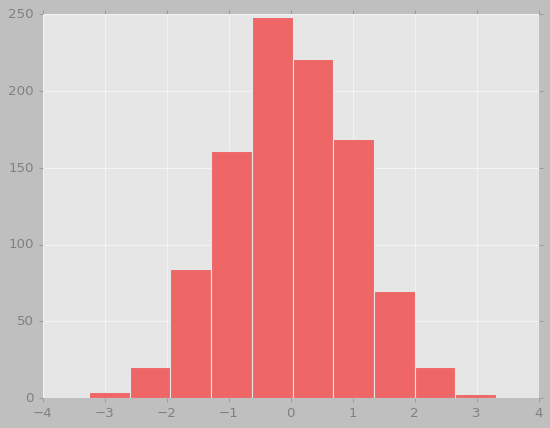
# use a gray background
ax = plt.axes()
ax.set_facecolor('#E6E6E6')
ax.set_axisbelow(True)
# draw solid white grid lines
plt.grid(color='w', linestyle='solid')
# hide axis spines
for spine in ax.spines.values():
spine.set_visible(False)
# hide top and right ticks
ax.xaxis.tick_bottom()
ax.yaxis.tick_left()
# lighten ticks and labels
ax.tick_params(colors='gray', direction='out')
for tick in ax.get_xticklabels():
tick.set_color('gray')
for tick in ax.get_yticklabels():
tick.set_color('gray')
# control face and edge color of histogram
ax.hist(x, edgecolor='#E6E6E6', color='#EE6666');

Changing the Defaults: rcParams
1
IPython_default = plt.rcParams.copy()
1
2
3
4
5
6
7
8
9
10
11
12
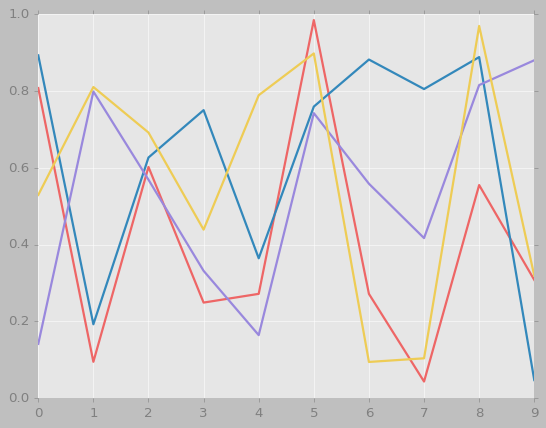
from matplotlib import cycler
colors = cycler('color',
['#EE6666', '#3388BB', '#9988DD',
'#EECC55', '#88BB44', '#FFBBBB'])
plt.rc('axes', facecolor='#E6E6E6', edgecolor='none',
axisbelow=True, grid=True, prop_cycle=colors)
plt.rc('grid', color='w', linestyle='solid')
plt.rc('xtick', direction='out', color='gray')
plt.rc('ytick', direction='out', color='gray')
plt.rc('patch', edgecolor='#E6E6E6')
plt.rc('lines', linewidth=2)
1
plt.hist(x);
1
2
3
# rc 매개변수를 활용했을 때 간단한 라인 플롯
for i in range(4):
    plt.plot(np.random.rand(10))
Stylesheets
1
plt.style.available[:5]
1
2
3
4
5
['Solarize_Light2',
 '_classic_test_patch',
 '_mpl-gallery',
 '_mpl-gallery-nogrid',
 'bmh']
1
2
3
4
5
6
7
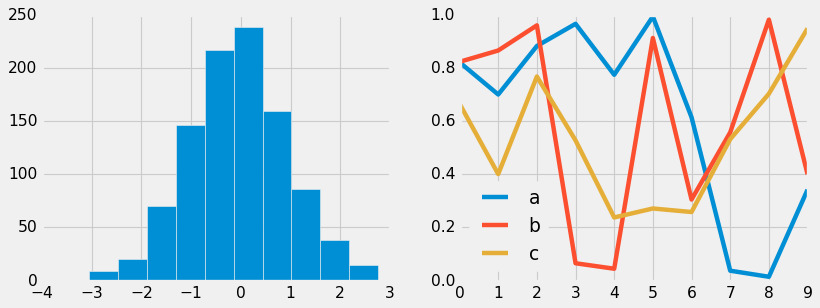
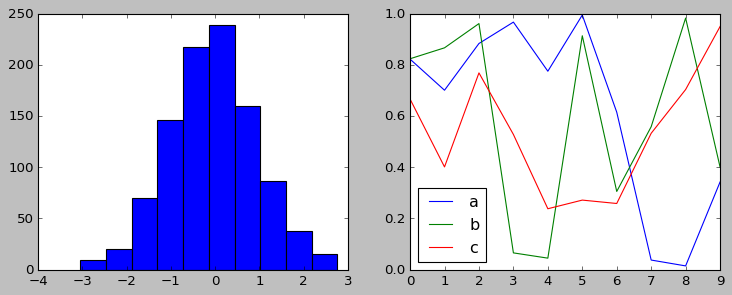
def hist_and_lines():
np.random.seed(0)
fig, ax = plt.subplots(1, 2, figsize=(11, 4))
ax[0].hist(np.random.randn(1000))
for i in range(3):
ax[1].plot(np.random.rand(10))
ax[1].legend(['a', 'b', 'c'], loc='lower left')
Default style
1
2
# reset rcParams
plt.rcParams.update(IPython_default);
1
hist_and_lines()

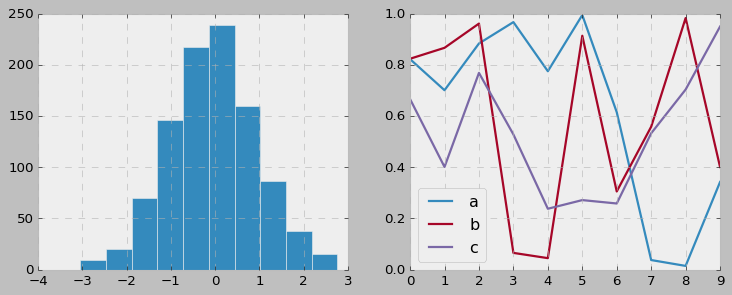
FiveThiryEight style
1
2
with plt.style.context('fivethirtyeight'):
    hist_and_lines()
ggplot
1
2
with plt.style.context('ggplot'):
    hist_and_lines()
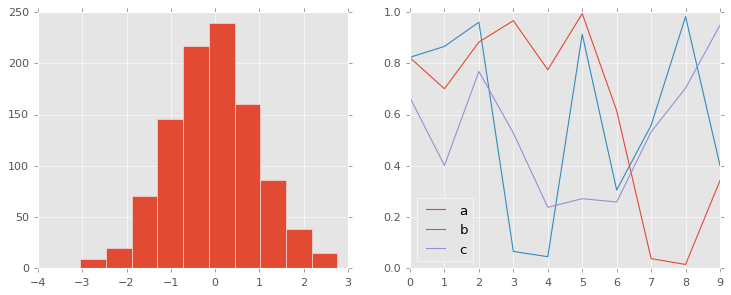
Bayesian Methods for Hackers style
1
2
with plt.style.context('bmh'):
    hist_and_lines()
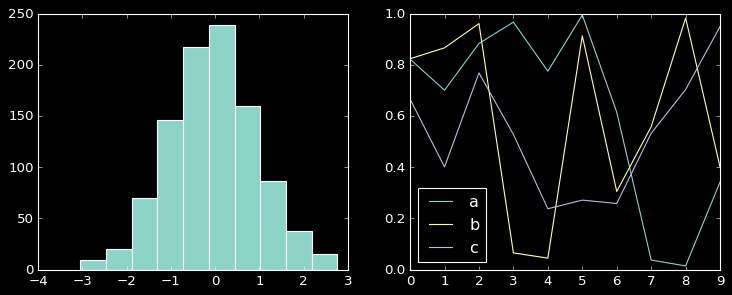
Dark background
1
2
with plt.style.context('dark_background'):
    hist_and_lines()
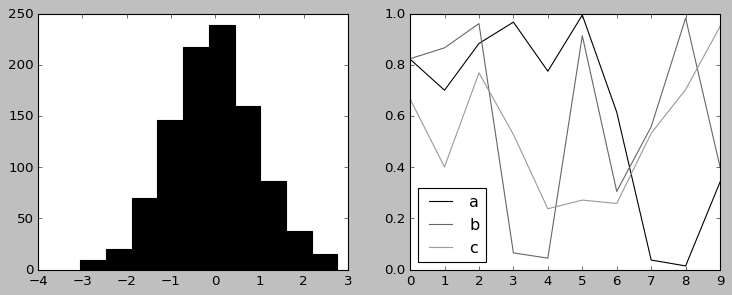
Grayscale
1
2
with plt.style.context('grayscale'):
    hist_and_lines()
Seaborn style
1
2
3
import seaborn

hist_and_lines()
이 기사는 저작권자의 CC BY-NC 4.0 라이센스를 따릅니다.