Customizing_Ticks
Customizing_Ticks
Customizing_Ticks
Major and Minor Ticks
1
2
3
4
5
6
import matplotlib.pyplot as plt

plt.style.use('classic')
%matplotlib
inline
import numpy as np
1
2
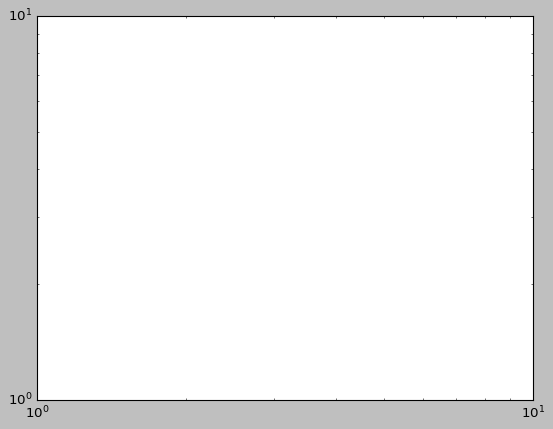
ax = plt.axes(xscale='log', yscale='log')
ax.grid();
1
2
3
4
print(ax.xaxis.get_major_locator())
print(ax.xaxis.get_minor_locator())
print(ax.xaxis.get_major_formatter())
print(ax.xaxis.get_minor_formatter())
1
2
3
4
<matplotlib.ticker.LogLocator object at 0x00000248AA1C4170>
<matplotlib.ticker.LogLocator object at 0x00000248AA350D10>
<matplotlib.ticker.LogFormatterSciNotation object at 0x00000248AA351160>
<matplotlib.ticker.LogFormatterSciNotation object at 0x00000248AA264BF0>
Hiding Ticks or Labels
1
2
3
4
5
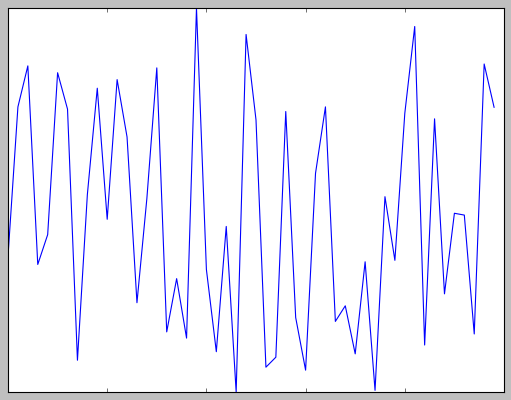
ax = plt.axes()
ax.plot(np.random.rand(50))
ax.yaxis.set_major_locator(plt.NullLocator())
ax.xaxis.set_major_formatter(plt.NullFormatter())
1
2
3
4
5
6
7
8
9
10
11
12
13
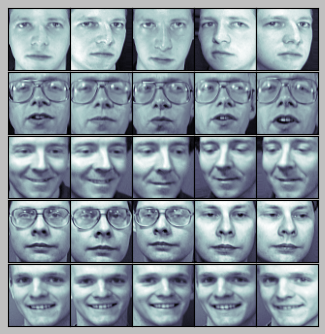
fig, ax = plt.subplots(5, 5, figsize=(5, 5))
fig.subplots_adjust(hspace=0, wspace=0)
# Get some face data from scikit-learn
from sklearn.datasets import fetch_olivetti_faces
faces = fetch_olivetti_faces().images
for i in range(5):
for j in range(5):
ax[i, j].xaxis.set_major_locator(plt.NullLocator())
ax[i, j].yaxis.set_major_locator(plt.NullLocator())
ax[i, j].imshow(faces[10 * i + j], cmap="bone")
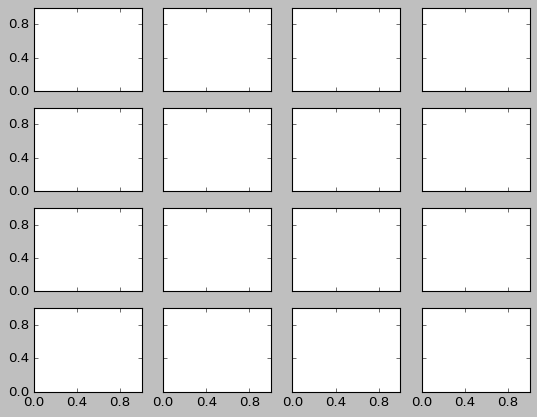
Reducing or Increasing the Number of Ticks
1
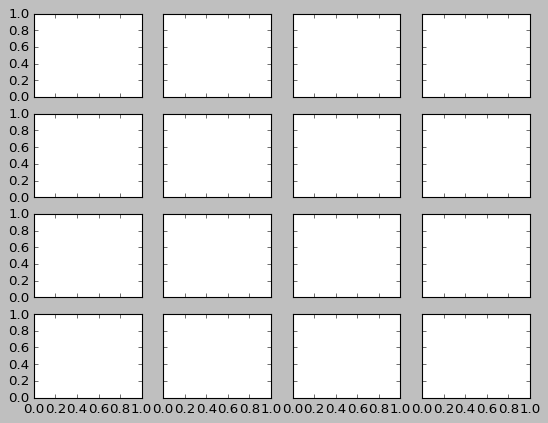
fig, ax = plt.subplots(4, 4, sharex=True, sharey=True)
1
2
3
4
5
6
# 모든 축에 대해 x와 y의 주 눈금의 위치 지시자를 설정
# For every axis, set the x and y major locator
for axi in ax.flat:
    axi.xaxis.set_major_locator(plt.MaxNLocator(3))
    axi.yaxis.set_major_locator(plt.MaxNLocator(3))
fig
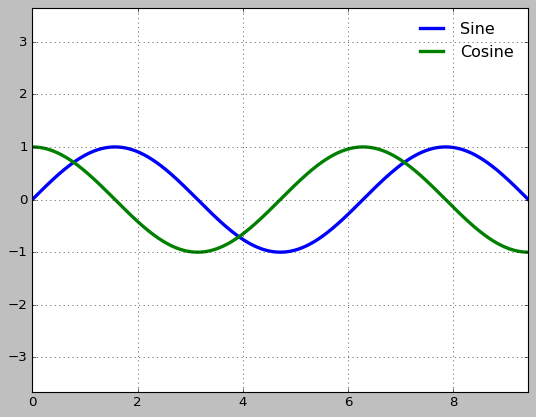
Fancy Tick Formats
1
2
3
4
5
6
7
8
9
10
11
# Plot a sine and cosine curve
fig, ax = plt.subplots()
x = np.linspace(0, 3 * np.pi, 1000)
ax.plot(x, np.sin(x), lw=3, label='Sine')
ax.plot(x, np.cos(x), lw=3, label='Cosine')

# Set up grid, legend, and limits
ax.grid(True)
ax.legend(frameon=False)
ax.axis('equal')
ax.set_xlim(0, 3 * np.pi);
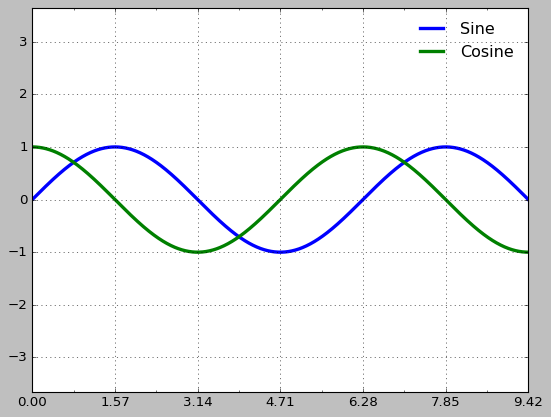
1
2
3
ax.xaxis.set_major_locator(plt.MultipleLocator(np.pi / 2))
ax.xaxis.set_minor_locator(plt.MultipleLocator(np.pi / 4))
fig
1
2
3
4
5
6
7
8
9
10
11
12
13
14
15
16
17
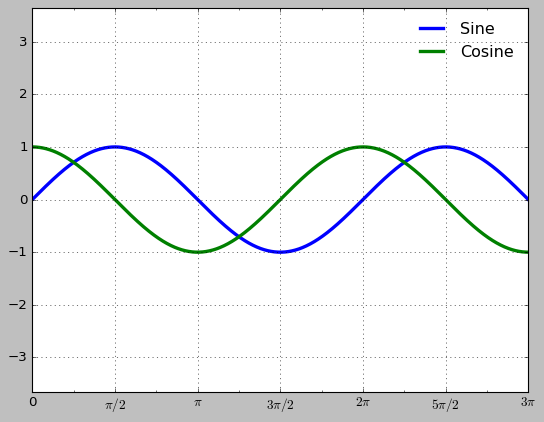
def format_func(value, tick_number):
# find number of multiples of pi/2
N = int(np.round(2 * value / np.pi))
if N == 0:
return "0"
elif N == 1:
return r"$\pi/2$"
elif N == 2:
return r"$\pi$"
elif N % 2 > 0:
return r"${0}\pi/2$".format(N)
else:
return r"${0}\pi$".format(N // 2)
ax.xaxis.set_major_formatter(plt.FuncFormatter(format_func))
fig
Summary of Formatters and Locators
위치 지시자
| Locator class | Description | EngDescription |
|---|---|---|
NullLocator | 눈금이 없음 | No ticks |
FixedLocator | 눈금 위치가 고정됨 | Tick locations are fixed |
IndexLocator | 인덱스 플롯을 위한 위치 지시자 | Locator for index plots (e.g., where x = range(len(y))) |
LinearLocator | min 부터 max 까지 일정한 간격을 두고 눈금을 위치시킴 | Evenly spaced ticks from min to max |
LogLocator | min 부터 max 까지 로그 단위로 눈금을 위치시킴 | Logarithmically ticks from min to max |
MultipleLocator | 눈금과 범위가 기본값의 배수 | Ticks and range are a multiple of base |
MaxNLocator | 눈금 최대 숫자에 맞게 적절한 위치를 찾음 | Finds up to a max number of ticks at nice locations |
AutoLocator | 간단한 기본값을 가지는 MaxNLocator | (Default.) MaxNLocator with simple defaults. |
AutoMinorLocator | 보조 눈금에 대한 위치 지시자 | Locator for minor ticks |
서식 지시자
| Formatter Class | Description | EngDescription |
|---|---|---|
NullFormatter | 눈금 레이블이 없음 | No labels on the ticks |
IndexFormatter | 레이블 목록에서 문자열을 설정 | Set the strings from a list of labels |
FixedFormatter | 레이블에 직접 문자열을 설정 | Set the strings manually for the labels |
FuncFormatter | 사용자 정의 함수가 레이블을 설정 | User-defined function sets the labels |
FormatStrFormatter | 각 값에 대한 포맷 문자열을 사용 | Use a format string for each value |
ScalarFormatter | 스칼라값에 대한 포맷 지시자 | (Default.) Formatter for scalar values |
LogFormatter | 로그 축에 대한 기본 포맷 지시자 | Default formatter for log axes |
이 기사는 저작권자의 CC BY-NC 4.0 라이센스를 따릅니다.