Multiple_Subplots
Multiple_Subplots
Multiple_Subplots
1
2
3
4
5
6
%matplotlib
inline
import matplotlib.pyplot as plt

plt.style.use('seaborn-v0_8-white')
import numpy as np
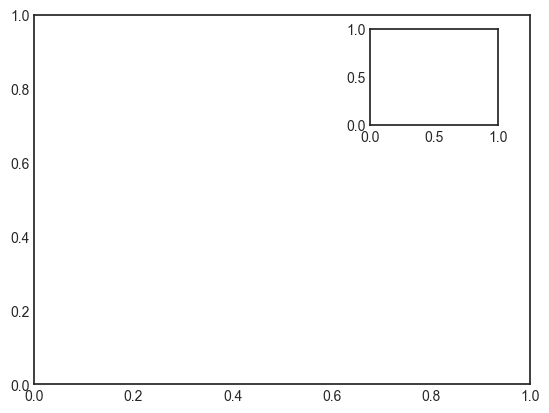
plt.axes: Subplots by Hand
1
2
ax1 = plt.axes()  # standard axes
ax2 = plt.axes([0.65, 0.65, 0.2, 0.2])
1
2
3
4
5
6
7
8
9
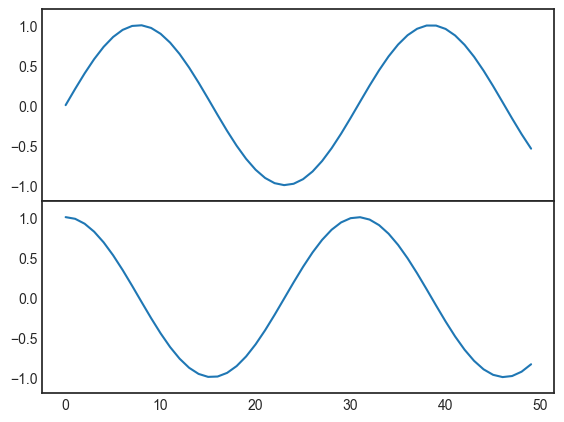
fig = plt.figure()
ax1 = fig.add_axes([0.1, 0.5, 0.8, 0.4],
xticklabels=[], ylim=(-1.2, 1.2))
ax2 = fig.add_axes([0.1, 0.1, 0.8, 0.4],
ylim=(-1.2, 1.2))
x = np.linspace(0, 10)
ax1.plot(np.sin(x))
ax2.plot(np.cos(x));
plt.subplot: Simple Grids of Subplots
1
2
3
4
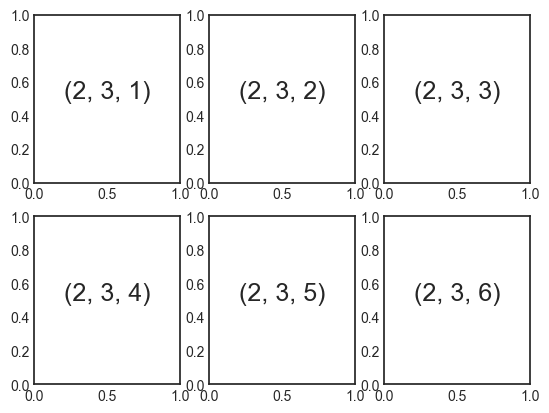
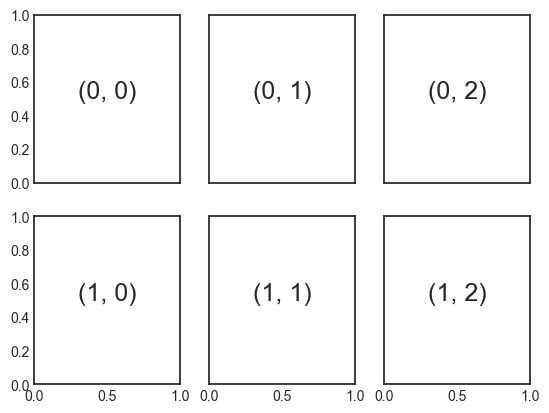
for i in range(1, 7):
plt.subplot(2, 3, i)
plt.text(0.5, 0.5, str((2, 3, i)),
fontsize=18, ha='center')
1
2
3
4
5
6
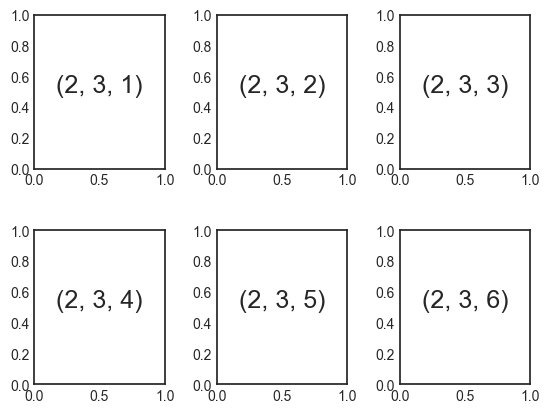
fig = plt.figure()
fig.subplots_adjust(hspace=0.4, wspace=0.4)
for i in range(1, 7):
ax = fig.add_subplot(2, 3, i)
ax.text(0.5, 0.5, str((2, 3, i)),
fontsize=18, ha='center')
plt.subplots: The Whole Grid in One Go
1
fig, ax = plt.subplots(2, 3, sharex='col', sharey='row')
1
2
3
4
5
6
# 축이 2차원 배열 안에 있어 [행, 열]로 인덱싱할 수 있음
for i in range(2):
    for j in range(3):
        ax[i, j].text(0.5, 0.5, str((i, j)),
                      fontsize=18, ha='center')
fig
plt.GridSpec: More Complicated Arrangements
1
2
3
4
5
6
grid = plt.GridSpec(2, 3, wspace=0.4, hspace=0.3)

plt.subplot(grid[0, 0])
plt.subplot(grid[0, 1:])
plt.subplot(grid[1, :2])
plt.subplot(grid[1, 2]);
1
2
3
4
5
6
7
8
9
10
11
12
13
14
15
16
17
18
19
20
21
22
23
24
25
26
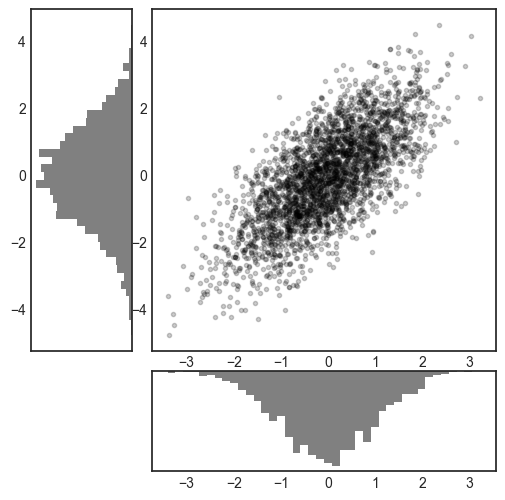
# 정규 분포 데이터 만들기
mean = [0, 0]
cov = [[1, 1], [1, 2]]
x, y = np.random.multivariate_normal(mean, cov, 3000).T
# gridspec으로 축 설정
# Set up the axes with gridspec
fig = plt.figure(figsize=(6, 6))
grid = plt.GridSpec(4, 4, hspace=0.2, wspace=0.2)
main_ax = fig.add_subplot(grid[:-1, 1:])
y_hist = fig.add_subplot(grid[:-1, 0], xticklabels=[], sharey=main_ax)
x_hist = fig.add_subplot(grid[-1, 1:], yticklabels=[], sharex=main_ax)
# 메인 축에 점 산포하기
# scatter points on the main axes
main_ax.plot(x, y, 'ok', markersize=3, alpha=0.2)
# 보조 축상에 히스토그램 만들기
# histogram on the attached axes
x_hist.hist(x, 40, histtype='stepfilled',
orientation='vertical', color='gray')
x_hist.invert_yaxis()
y_hist.hist(y, 40, histtype='stepfilled',
orientation='horizontal', color='gray')
y_hist.invert_xaxis()
이 기사는 저작권자의 CC BY-NC 4.0 라이센스를 따릅니다.